To build on Vili’s earlier post about the geographies of virtual gold farming, I want to share a bit of our spatial analysis (conducted with the help of Claudio Calvino and Stefano De Sabbata) of the data we are using in our ‘digital labour and development‘ project.
The platform, PlayerAuctions, kindly shared a month’s worth of transaction data with us. PlayerAuctions is a marketplace that allows digital assets in/from games to be traded (e.g. in-game currency, accounts, and power leveling services).
We took that data and examined that spatial distribution of buyers:

and sellers:

What we see is that despite a potential for anyone with an internet connection to engage in this sort of digital production and consumption, the actual practices have distinct geographies. It is also instructive to examine the specific flows of work (as we do in the network below).

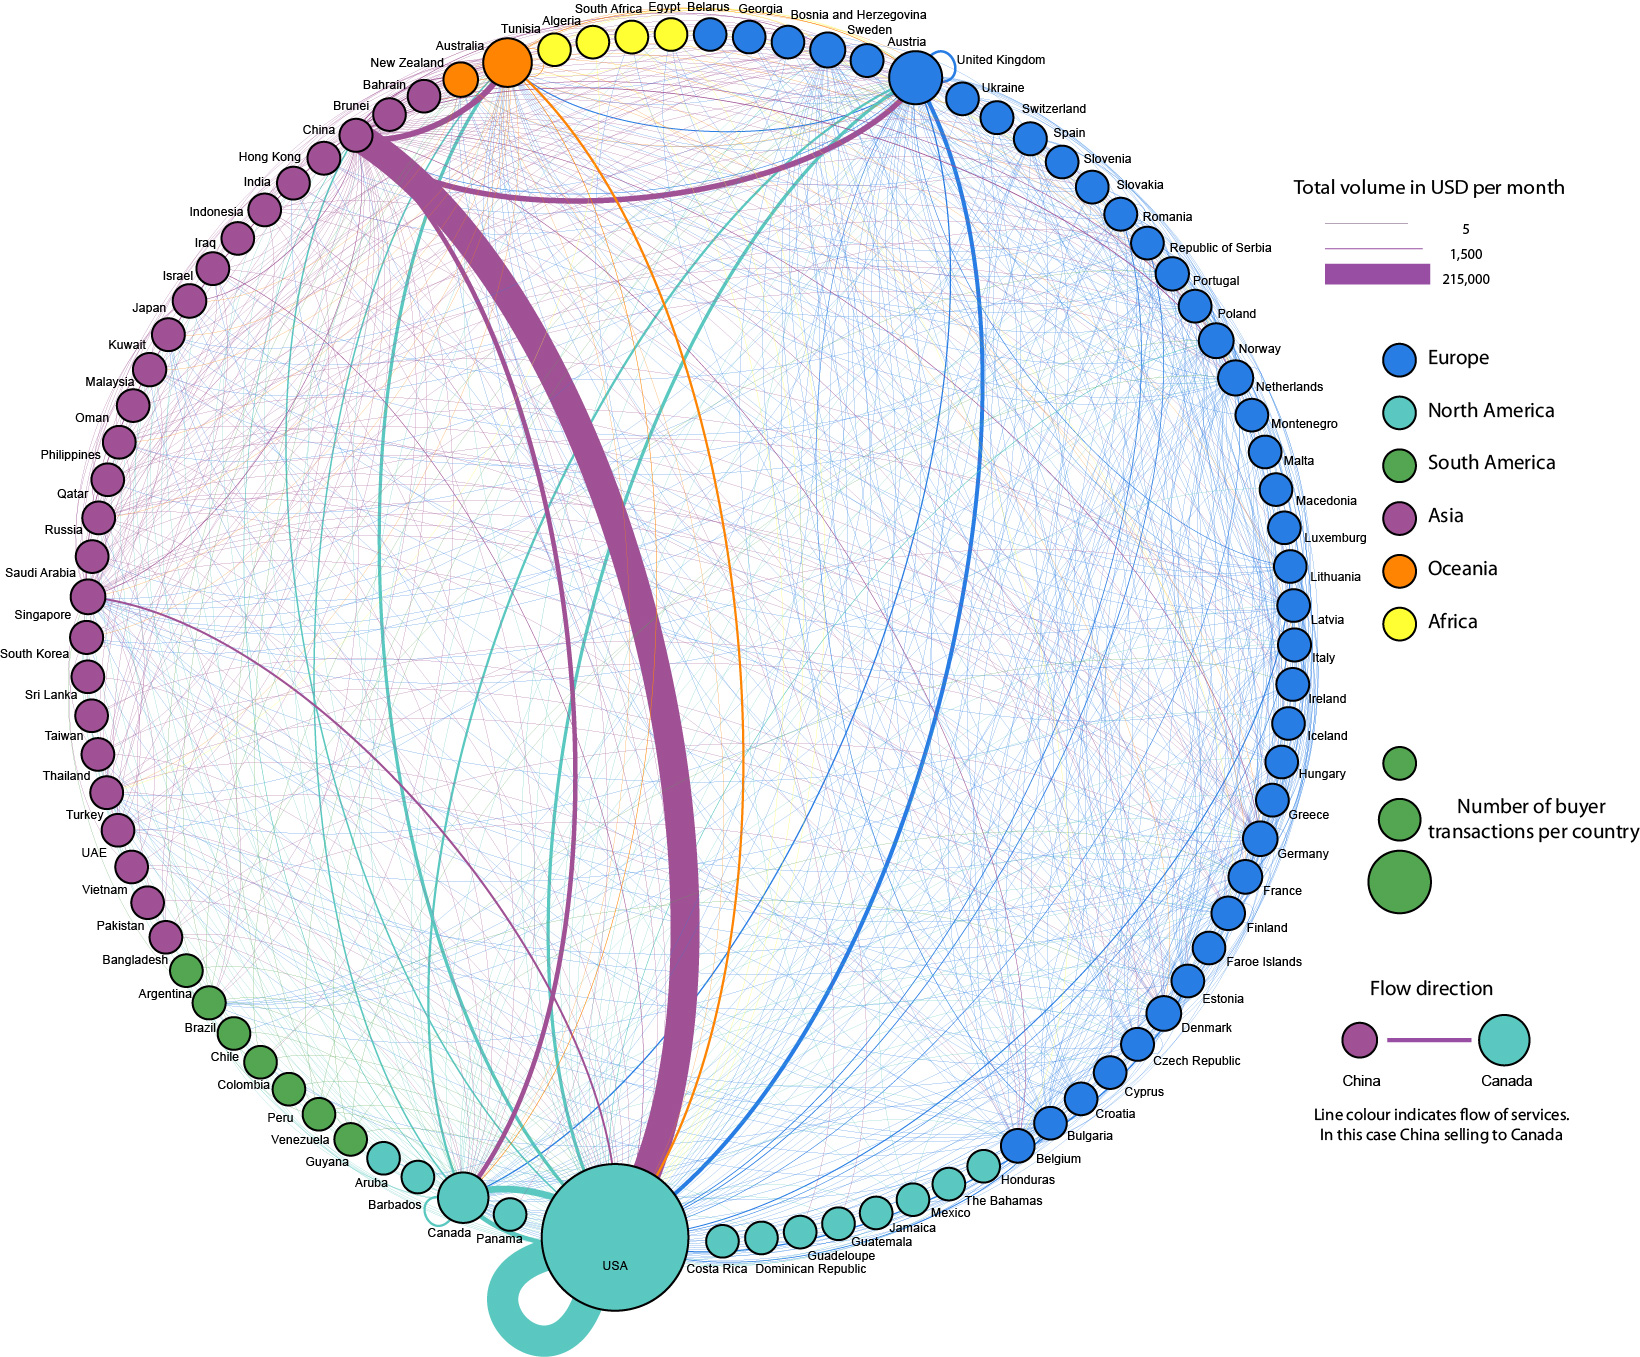
In that network diagram, each node (circle) is a country (the size of each country indicates the number of buyers in that country, and the colour of each node indicates the region of the world that that country is in). Each edge (line) indicates the flow of work from one country to another. The colour of the line indicates the country that that work came from and the thickness of the line illustrates the volume of trade between the two countries that the line connects. So, for example, the very thick purple line that connects China (at the top of the network diagram) to the USA (at the bottom) shows the large amount of trade between those two countries.
What these visualisations show us more generally, is something that we alluded to in our previous post on the topic: that there are important institutional and social factors (cultural fluency, communication, access to formal institutions, etc.) directing the trade in digital game assets.