Further to a short paper I wrote with Arzu, Kathryn, Scott, and Ralph (see Collaborative Visualizations for Wikipedia Critique and Activism), I started working on Vis-à-Wik, a simple online visual analytics tool for Wikipedia analysis. Vis-à-Wik retrieves data from the MediaWiki Wikipedia API, and uses D3js to visualize the links between Wikipedia articles as a network diagram. This simple tool allows users to search for Wikipedia articles in a selected language edition, and visualize the articles selected by the user as a set of nodes, along with the related articles in a second language edition, and the links and language-links between them. The aim is facilitate mid-scale analysis of Wikipedia content — that is somewhere between a single-page analysis (that editors do routinely) and large-scale analyses (e.g., academic research projects).
Vis-à-Wik is available for testing at sdesabbata.github.io/vis-a-wik, while the code is available on GitHub (github.com/sdesabbata/vis-a-wik) under the GPLv3 licence. This is not a collaborative visualization tool, and currently implements only one of the visualization methods, but it is a first step (hopefully) of a larger endeavour.
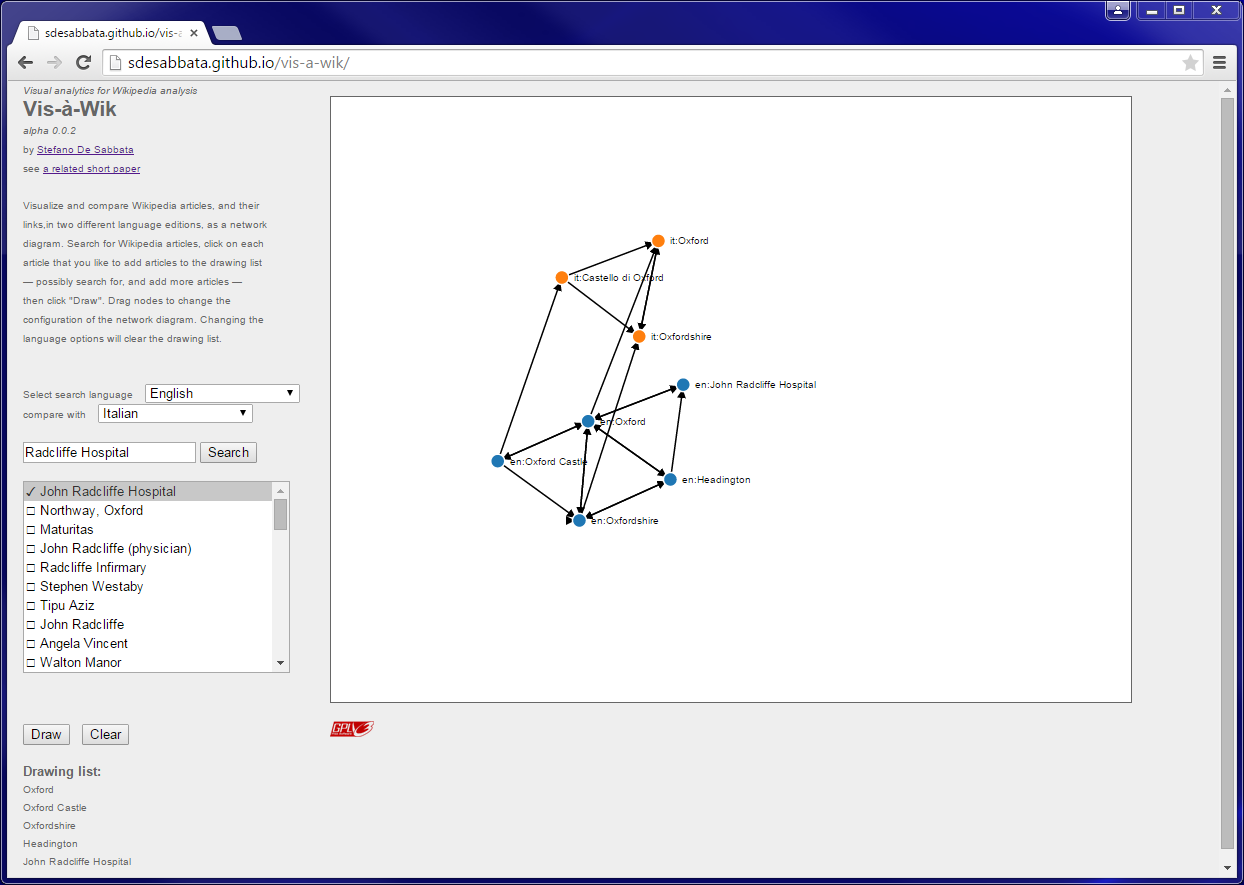
The image below is a screenshot showing the same graph in the illustrative example presented in Collaborative Visualizations for Wikipedia Critique and Activism.

Vis-à-Wik screenshot.